India Human Development Survey: August 2024

The IHDS Forum is a monthly update of socio-economic developments in India by the IHDS research community, based on the India Human Development Survey, jointly conducted by NCAER and the University of Maryland. While two earlier rounds of the survey were completed in 2004-05 and 2011-12, respectively. Fieldwork for the third round was undertaken in 2022-24 and the data is currently being cleaned and processed.

Click here for previous issues

The road to 2047 for Indian agriculture

There are several challenges but also opportunities.

India’s agricultural sector faces challenges, including climate change, land degradation, and market access issues. The Pradhan Mantri Fasal Bima Yojana (PMFBY), introduced in 2016, provides financial assistance for crop losses. With 49.5 crore farmers enrolled and claims totalling over ₹1.45 lakh crore, the scheme is a cornerstone of agricultural risk management.

The Electronic National Agriculture Market (eNAM), launched in 2016, integrates existing markets through an electronic platform. By September 2023, 1,361 mandis had been integrated, benefiting 1.76 million farmers and recording trade worth ₹2.88 lakh crore. This initiative improves market access and ensures better price realisation for farmers.

Despite agriculture engaging nearly 46% of the workforce, agriculture’s contribution to GDP is about 18%, highlighting a stark imbalance. If current growth trends continue, this disparity will worsen: while overall GDP has grown at 6.1% annually since 1991-92, agricultural GDP lags at 3.3%. Under the Narendra Modi administration, overall GDP growth was 5.9%, and agriculture grew at 3.6%. However, this is insufficient for a sector so critical to the nation’s socio-economic fabric.

By 2047, agriculture’s share in GDP might shrink to 7%-8%, yet, it could still employ over 30% of the workforce if significant structural changes are not implemented. This indicates that merely maintaining the current growth trajectory will not suffice.

The expected 7.6% overall GDP growth for 2023-24 is promising. However, the agri-GDP’s anaemic growth of 0.7%, primarily due to unseasonal rains, is alarming.

Further, according to United Nations projections, India’s population is expected to reach 1.5 billion by 2030 and 1.59 billion by 2040. Following the agricultural challenges, meeting the food requirements of this burgeoning population will be imperative. With an estimated expenditure elasticity of food at 0.45, the demand for food is expected to grow by approximately 2.85% annually, considering the population growth rate of 0.85%.

India’s real per capita income increased by 41% from 2011-12 to 2021-22 and is projected to accelerate further. However, the expenditure elasticity post-2023 is anticipated to be lower, correlating a 5% rise in per capita expenditure to a 2% growth in demand. The anticipated food demand will vary among commodities, with meat demand growing by 5.42% and rice demand by a mere 0.34%.

To address these challenges, rationalising food and fertilizer subsidies and redirecting savings towards agricultural research and development innovation and extension services are crucial.

Some initiatives

Several initiatives have been rolled out to bolster farmer prosperity and sustainable agricultural growth. The Pradhan Mantri Kisan Samman Nidhi (PM-KISAN), launched in 2019, disburses ₹6,000 annually to farmers in three instalments. This scheme has already benefited over 11.8 crore farmers, offering much-needed financial support. Another critical initiative, the Soil Health Card (SHC) scheme, aims to optimise soil nutrient use, thereby enhancing agricultural productivity. Over 23 crore SHCs have been distributed, providing farmers with crucial insights into soil health and nutrient management.

The government also championed the International Year of Millets in 2023, promoting nutritious coarse grains, both domestically and internationally.

The Agriculture Infrastructure Fund, with a ₹1 lakh crore financing facility, supports the development and modernisation of post-harvest management infrastructure. Within three years, over 38,326 projects have been sanctioned, mobilising ₹30,030 crore in the agricultural infrastructure sector. These projects have created employment for more than 5.8 lakh individuals and improved farmer incomes by 20%-25% through better price realisation.

Moreover, the Survey of Villages and Mapping with Improvised Technology in Village Areas (SVAMITVA) initiative aims to ensure transparent property ownership in rural areas. As of September 2023, over 1.6 crore property cards have been generated, enhancing land security and facilitating credit access for farmers.

Strategic planning

The government’s strategic planning for agriculture, leading up to 2047, focuses on several key areas: anticipated future demand for agricultural products, insights from past growth catalysts, existing challenges, and potential opportunities in the agricultural landscape. Projections indicate that the total demand for food grains in 2047-48 will range from 402 million tonnes to 437 million tonnes, with production anticipated to exceed demand by 10%-13% under the Business-As-Usual (BAU) scenario.

However, to meet this demand sustainably, significant investments in agricultural research, infrastructure, and policy support are required. The Budget for 2024-25, with an allocation of ₹20 lakh crore for targeted agricultural credit and the launch of the Agriculture Accelerator Fund, highlights the government’s proactive approach to fostering agricultural innovation and growth.

The road to 2047 presents both challenges and opportunities for Indian agriculture. By embracing sustainable practices, leveraging technological innovations, and implementing strategic initiatives, India can enhance farmer incomes, meet the food demands of its growing population, and achieve inclusive, sustainable development.

Souryabrata Mohapatra is with the National Council of Applied Economic Research (NCAER), New Delhi. Sanjib Pohit is with the National Council of Applied Economic Research (NCAER), New Delhi. Views are personal.

‘Connector’ countries in a geoeconomically fragmented world

As the global economy fragments along geopolitical lines, countries are seeking new ways to flourish, or at least insulate themselves against geopolitical shocks. Drawing from a newly constructed database, this column explores the concept of ‘connector’ countries, which can be vertical along supply chains or horizontal across markets. The authors argue that vertical connectors may increasingly come under political pressure, whereas horizontal connectors may be more resilient to geopolitical shocks. Countries that are more open to global trade and investment and have more efficient financial markets are better horizontal connectors.

In principle, a country that relies heavily on economic transactions with countries with diverging geopolitical views is at greater risk of geopolitical disruptions. But risk may also turn to opportunity: a country that interacts with a wide range of partner countries with diverse geopolitical leanings might be more resilient to disruptions from individual partner countries, and might even benefit due to trade or FDI diversion from rival blocs. Gopinath et al. (2024) call such countries ‘connectors’.

In a recent paper (Aiyar and Ohnsorge 2024), we formalise the concept of connectedness as the property of transacting with international partners drawn from across the ideological spectrum, and discuss some examples of connector countries. We also show that more open and financially developed countries tend to be more connected.

Data and methodology

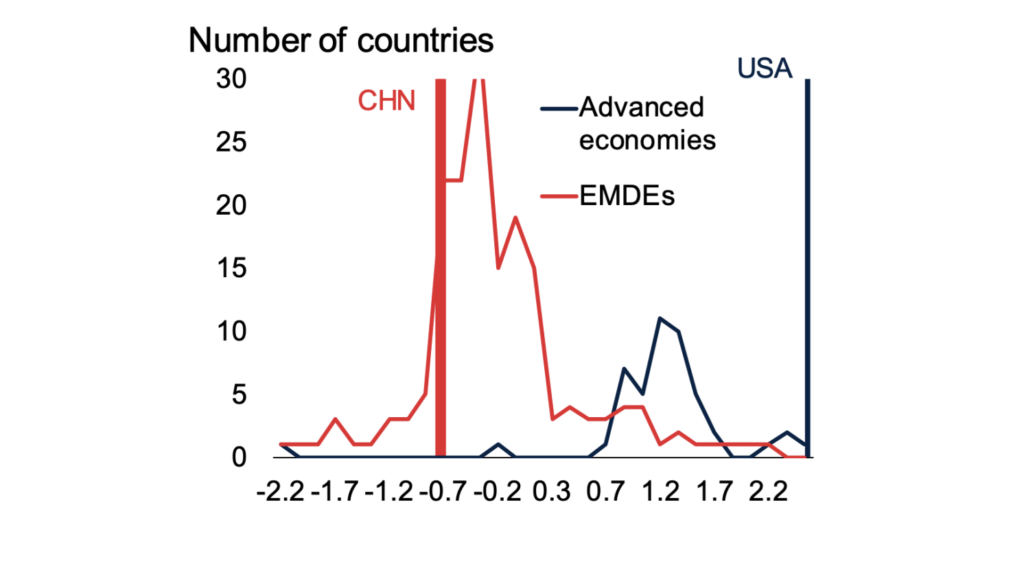
Following Aiyar et al. (2023b) and Gopinath et al. (2024), we use data on voting patterns at the United Nations to measure a country’s geopolitical stance. Specifically, we employ the ideal point index calculated by Bailey et al. (2017). Broadly speaking, over the past decade countries’ geopolitical stances have been clustered into two camps: emerging market and developing economies (EMDEs) and advanced economies (Figure 1). Most EMDEs have voting patterns similar to China, while most advanced economies have voting patterns somewhere between the US and China, but closer to the US.

Figure 1 Distribution of geopolitical stances, 2023

Source: Bailey et al. (2017); Aiyar and Ohnsorge (2024).
Note: The figure shows the ideal point index, a measure of geopolitical stance based on UN voting patterns.

The ideal point distance (IPD) between two countries at any given point in time measures bilateral ‘geopolitical distance’. We combine this with bilateral data on trade (primarily from CEPII and the IMF’s Direction of Trade Statistics), foreign direct investment (FDI, mainly from the IMF’s Coordinated Direct Investment Survey and the OECD), portfolio liabilities (from the IMF’s Coordinated Portfolio Investment Survey), and cross-border bank liabilities (from BIS Consolidated Banking Statistics). The resulting database is available at Harvard Dataverse.

Previous papers, based on proprietary databases, have shown that an increase in geopolitical distance between a pair of countries is associated with diminished bilateral transactions (e.g. Aiyar et al. 2023b for FDI, and Gopinath et al. 2024 for trade). We find greater geopolitical distance is associated with significantly diminished transactions across all categories. The effect is strongest for FDI, with more muted effects for capital goods exports, portfolio investment liabilities, and liabilities to BIS-reporting banks.

Geoeconomic vulnerability and geoeconomic connectedness

Following IMF (2023), we create an index of geoeconomic vulnerability, GeoV, that is defined as the transaction-weighted average of geopolitical distances. Thus, for example, Mexico’s GeoV for exports is calculated by multiplying its IPD vis-vis a given country by the share of Mexico’s exports to that country, and then summing over countries.  GeoV captures the intuition that the more a country transacts with geopolitically distant countries, the greater its vulnerability to a geopolitical shock.

But, of course, this simple weighted average is only one aspect of a more complicated story. In a geopolitically fragmented world, it may not be wise to put all one’s eggs in a single basket. While a country may have a low probability of being hit by a geopolitical shock if it only trades with one politically aligned partner, it would be devastated if a shock actually materialises. From this perspective, diversifying transactions across partners drawn from a range of geopolitical preferences could build resilience to shocks.

We construct an index of geoeconomic connectedness, GeoC, based on the weighted standard deviation of a country’s geopolitical distance from partner countries. Roughly speaking, this means that a country is more connected if its transactions are balanced across many partners drawn from the full range of ideological preferences. GeoC has several attractive properties apart from its simplicity; it uses all the bilateral data available, and does not require any assumptions about which countries belong to which blocs. To the best of our knowledge, it is the first quantitative proposal for measuring how connected a country is in the geopolitical sphere, in a way that is comparable across countries, across time, and across types of transactions.

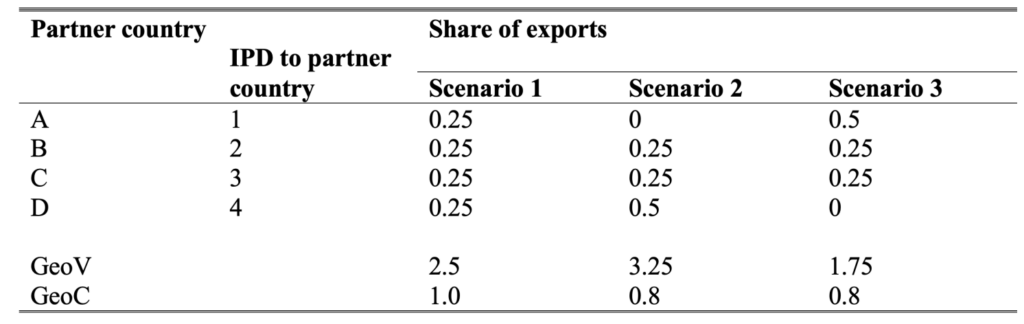
The difference between GeoV and GeoC is illustrated by the simple example in Table 1. Suppose that a country initially trades equally with four partner countries, at varying geopolitical distances. Now suppose that the country reduces its trade with the geopolitically closest partner, while increasing its trade with the most geopolitically distant partner. Clearly, this increases geoeconomic vulnerability. Conversely, if it increases its trade weight with the geopolitically closest partner, while reducing its trade weight with the most geopolitically distant partner, this reduces geoeconomic vulnerability. But connectedness is reduced in either case, because the country now transacts with a more geopolitically concentrated set of countries.

Table 1 Interpretation of GeoV and GeoC

Source: Aiyar and Ohnsorge (2024).

‘Vertical’ versus ‘horizontal’ connectors: Mexico vs Vietnam

In principle, one could think of connector countries as connectors across markets or connectors across types of transaction.

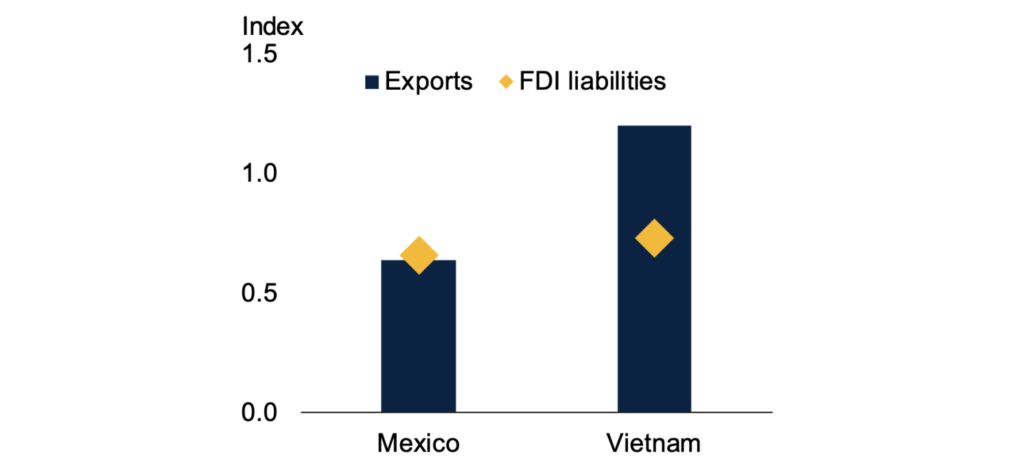
Consider Mexico and Vietnam. Both have a similar degree of FDI diversification. However, Mexico’s exports are overwhelmingly to a single country, the US, whereas Vietnam’s exports are among the most diversified for EMDEs (Figure 2).

When authors such as Gopinath et al. (2024) or Alfaro and Chor (2023) refer to Mexico as a connector country, they are appealing to the concept of connectors across types of transactions in particular supply chains, akin to a ‘vertical connector’: the idea that Mexico will increasingly use Chinese FDI to produce exports for the US market, thus substituting for direct Chinese exports to the US.

But whether this type of connector will gain traction at scale is a matter of some doubt. Republican presidential nominee Donald Trump, in his speech at the Republican National Convention, stated: “[a]nd right now as we speak, large factories, just started, are being built across the border in Mexico. [T]hey’re being built by China to make cars and to sell them into our country, no tax, no anything…[W]e’re going to bring back car manufacturing and we’re going to bring it back fast.” (New York Times 2024). Similar sentiments have been expressed in more guarded language by Katherine Tai, the Biden administration’s trade representative (Associated Press 2024).

In contrast, Vietnam’s highly diversified base of export destinations, akin to a ‘horizontal connector’, gives it some protection against geopolitical risk. If a geopolitical shock were to cut it off suddenly from one export partner, it would have many other partners to turn to. It is therefore a connector across markets. Since this is the conceptual underpinning of our metric of connectedness, Vietnam has a much higher GeoC than Mexico.

Figure 2 Geoeconomic connectedness of Mexican and Vietnamese exports and FDI liabilities, latest

Source: Bailey et al. (2017); IMF; Aiyar and Ohnsorge (2024); World Bank.
Note: Geoeconomic connectedness is the export or FDI liability-weighted standard deviation of ideal point distances for Mexico and Vietnam. Latest available data for FDI are 2022; for exports 2023.

Correlates of connectedness

Which countries are more connected across ideologically disparate partners, thus enabling them to develop some degree of resilience to growing geopolitical fragmentation?

We find that openness is important along several dimensions. A country’s exports are more geoeconomically connected when tariffs are lower and when the country is part of a larger free trade area. Higher-quality logistics – including the ability to track and trace shipments, fewer delays at ports, better trade and transport infrastructure, and more streamlined customs procedures – are also beneficial. And EMDEs with more open capital accounts tend to attract more diversified sources of capital inflows.

Financial market development is particularly important for diversified capital inflows. Deeper and more sophisticated financial markets and institutions facilitate entry and exit and are associated with greater connectedness in FDI, portfolio liabilities, and lending from global banks.

It should be noted that these correlates of greater connectedness are just that – correlates. More research would be required to establish a causal relationship between policy variables and the ability to flourish in a geoeconomically fragmented world. We hope that our work provides a useful first step.

Inflation Targeting in India: A Further Assessment

We assess India’s inflation-targeting regime at the eight-year mark. The Reserve Bank of India continues to be a flexible inflation targeter: it responds to both the output gap and inflation when setting policy rates. It has become neither more hawkish nor more reactive with the transition to inflation-targeting. Evidence points to improved outcomes: inflation is lower and less volatile; inflation expectations are better anchored; and the transmission of monetary policy is more effective. Given this record, radical changes such as broadening the RBI’s monetary mandate, abandoning the target in favor of a more discretionary regime, targeting core instead of headline inflation, or altering the target and tolerance band would be risky and counterproductive. One obvious area for improvement entails updating the weight of food prices in the CPI basket. We estimate the correct weight of food at today’s per capita income to be closer to 40 percent instead of the current 45.8 percent. This would likely fall further to around 30 percent in a decade from now due to the projected increase in per capita incomes. This correction should ameliorate concerns about the design and practice of the current inflation targeting regime.

    Get updates from NCAER