Household expenditure on education dropped after 2010. Three ways to increase investment

In communities where education is given greater importance & viewed as a gateway to success, households are more likely to allocate a larger portion of income toward educational expenses.

Education is the cornerstone upon which nations build their future. It is the bedrock of social and economic growth at the macro level, leading to individual empowerment and social stability. In India, a country with a large population and diverse socioeconomic landscape, understanding the trends in household expenditure on education provides crucial insight into the household’s contribution and participation in building and enhancing human capital.

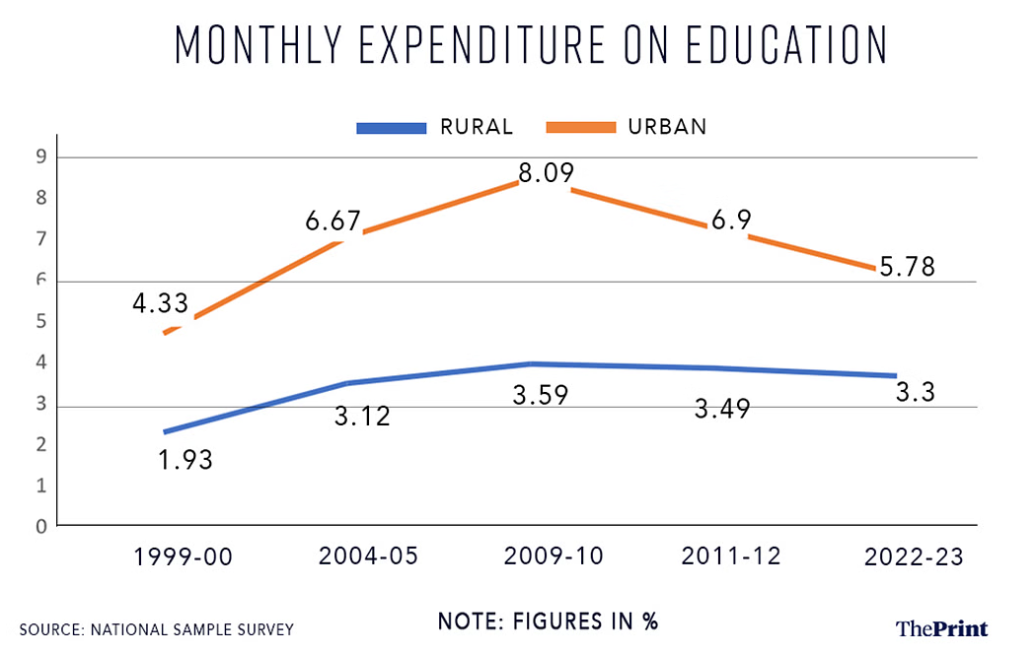
Toward this, we refer to the National Sample Survey (NSS). The outcome of the surveys has served as one of the barometers for gauging household expenditure trends across rural and urban India. A close examination of the data from the NSS rounds spanning from 1999-2000 to 2022-2023 unveils an intriguing narrative of fluctuations and patterns in education spending. The survey on education spending by households covers expenditure on books, journals, newspapers, periodicals, library charges, stationery and photocopying charges, tuition and other fees, private tuition/coaching centre expenditure, and other expenses like fees for enrolment in web-based training etc.

Ascending trajectory
The turn of the millennium witnessed a significant uptick in household expenditure on education. According to data from the 55th round of NSS (1999-2000), rural households allocated 1.93 per cent of their expenditure towards education, while urban households earmarked 4.33 per cent—almost 2.5 percentage points difference. Over the subsequent NSS rounds, this allocation exhibited a commendable upward trajectory. By the 66th round of NSS (2009-2010), the expenditure had swelled to 3.59 per cent for rural households and 8.09 per cent for urban households, with a 4.5 percentage points difference.

Leaving the rural-urban divide gap aside, the rise in household expenditure spending on education could be indicative either of a growing household commitment to higher spending towards education or the rising education cost eating into household expenditure or both factors playing in tandem.

This period also marked a notable phase of prioritisation of education expenditure, driven by various factors including increasing awareness of the role of education in socio-economic advancement, policy initiatives aimed at universalising education, and rising aspirations among the populace.

Plateau and decline post-2010
The upward trend in education spending by households plateaued post-2009-2010, followed by a gradual decline in subsequent years. The 68th round of NSS (2011-2012) revealed a decrease in education expenditure, with rural households’ allocation falling marginally to 3.49 per cent and urban households’ spending falling drastically to 6.9 per cent. The most recent data from 2022-2023 paints a more sobering picture. Rural households allocated 3.3 per cent of their expenditure to education, while urban households dedicated 5.78 per cent. This downward trend raises pertinent questions.

The decline in household spending on education post 2009-10 requires further analysis. Whenever the unit-level data is made available in the public domain, a more in-depth analysis will be forthcoming on the wavering behaviour of education spending by households.

Interpreting trends
Interpreting the trends in household expenditure on education necessitates a comprehensive understanding of the multifaceted factors influencing the spending. Since the survey reflects the “out-of-pocket expenditure” of households, the numbers show that the economic conditions of households as well as the cost of education exert a significant influence on spending habits. It also shows the preference of households for certain educational pursuits.

Government policies and initiatives also play a pivotal role in shaping education expenditure patterns. Increased investment in education infrastructure, scholarships, and subsidies/reimbursements of costs tend to ease “out-of-pocket” spending on education. Conversely, shifts in policies or austerity measures may dampen government expenditure levels and put stress on households as they have to adjust their budgets in response to changing circumstances.

Moreover, societal attitudes towards education, deeply rooted cultural norms and values significantly influence expenditure patterns. In communities where education is accorded greater importance and viewed as a gateway to success, households are more likely to allocate a larger portion of their income towards educational expenses.

Toward inclusive education
As India aims to harness its demographic dividend, it is imperative to ensure equitable access to quality education across all strata of society. Addressing the existing disparities between rural and urban areas necessitates targeted interventions aimed at enhancing accessibility and affordability in underserved regions. The varying patterns in household spending on education underscore the urgent need for collaborative action in constructing a more inclusive and robust educational framework.

First, substantial investments are required in educational infrastructure to bridge the gap between rural and urban areas. This entails developing schools, colleges, and vocational training centres, especially in underserved regions. The availability of infrastructure impacts household spending on education.

Second, policy initiatives to ease the financial burden of education on families, such as scholarships, fee reductions, and income-based loan programs can improve accessibility and encourage wider participation in education.

Finally, involving local communities, parents, and stakeholders in the educational process fosters a sense of ownership and responsibility, thereby maximising education spending and fostering greater social cohesion.

While the fluctuating trends in household expenditure on education present a complex narrative, they also offer valuable insights into the evolving dynamics of education in India. By addressing the underlying challenges and leveraging opportunities for reform, India can chart a path towards a more inclusive, equitable, and affordable education system, thereby unleashing the full potential of its human capital. Higher investment in education should not only be a moral imperative but also a strategic way forward to secure a prosperous and sustainable future.

Palash Baruah is Associate Fellow at National Council of Applied Economic Research (NCAER), New Delhi and DL Wankhar is a retired officer of the Government of India. Views are personal.

Raw deal for women in the fisheries sector

Despite making significant contributions and accounting for a large share of the workforce, women’s concerns and interests are frequently disregarded.

India is second only to China in fish production. In 2022-23, India produced around 18 million tonnes, accounting for 8 per cent of global production. About 32 per cent of this came from marine sources, and 68 per cent from inland sources. The fisheries sector contributes 1.09 per cent to India’s GVA, and over 6.7 per cent to agriculture GVA.

Water bodies are an important source of inland fishery. Per the Census of Water Bodies by the Ministry of Jal Shakti (Census conducted during 2018-19 and reported in 2023), here are 2.4 million water bodies in the country, of which 97.1 per cent are in rural areas and 2.9 per cent in urban. The distribution of water bodies is as follows: 59.5 per cent are ponds; 15.7 per cent, tanks; 12.1 per cent, reservoirs; 9.3 per cent, water conservation schemes/percolation tanks/check dams; 0.9 per cent, lakes; 2.5 per cent, others.

Inland fisheries provide employment and livelihood support to over 28 million people in India, of which women are an integral part, helping with pre- and post-harvest work — peeling, seafood processing, community care, etc. An NCAER study observed that women’s concerns and interests are frequently disregarded.

For instance, women workers in the fish mandi of Srikakulam district of Andhra Pradesh complain about not having separate toilet facilities despite shouldering equal responsibilities in the entire marketing activities. There are still significant gaps in our understanding of gender relations in the fisheries sector.

Work overlooked

In India, women make up 72 per cent of the fisheries workforce (FAO, 2016), with 57 per cent engaged in seed collection, 73.6 per cent in marketing, and 75.7 per cent in curing and processing (CMFRI, 2010). Despite their significant contributions, women’s work is often overlooked. Processing industries often employ women, but rigid working hours, household responsibilities, and distance from the workplace make it difficult for them to attend work on time, leading to stress and even injuries.

The Central Institute for Women in Agriculture (CIWA) has calculated the Gender Work Participation Disparity Index in fisheries, which varies from State to State. In Nagaland, Manipur, and Himachal Pradesh it is < 0.15, whereas in Punjab, Haryana, Kerala, Uttar Pradesh, Bihar and Odisha, it is between 0.34 and 0.59 (CIWA, 2015).

Ownership of land and other productive resources is primarily male-dominated; in developed countries, women hold 20 per cent of land, and in underdeveloped countries, it is only 2 per cent. Due to several collateral factors or male dominance, women do not have access to financial facilities or marketing agreements. Women’s engagement in agriculture and related fields has been restricted by technological improvements that have primarily benefited men.

In 97 countries, just 5 per cent of agricultural extension services are received by female farmers, indicating that women’s access to these services is restricted. Women are left behind at home when males migrate elsewhere in search of employment, which results in excess workload and less prospects for income generation. In fisheries, women are under-represented on official decision-making platforms, which makes sustained reforms challenging. Sensitivity to gender issues, women-supportive marketing infrastructure, gender-responsive research, gender main-streaming of course curriculums, and gender-disaggregated data collection are crucial for sustainable transformation of the fishery sector.

The writers are Senior Fellow and Fellow, respectively, at NCAER

Odisha’s Breakout Moment is here!

Odisha, India’s eleventh largest state by population and fourteenth largest by size of economy, has come a long way during the last two decades. At nearly $ 100 billion, if Odisha were a country, its economy would be larger than Tanzania, Sri Lanka or Ghana.

The growth momentum has been evident across sectors including   agriculture, manufacturing, and services. Additionally, at nearly 10 percent of its economy, and growing at 8 percent annually mining has contributed to Odisha’s economic well-being as well as to its robust public finances.  Thanks to the mining royalties, the state has a unique fiscal advantage. It collected non-tax revenue to the tune of 3.5 percent of its GDP a year compared to 1 percent for an average Indian state during the last decade.

The state’s rising prosperity has been accompanied by notable improvements in a variety of socio-economic markers such as gross enrollment ratio, gender parity index, infant mortality rate, fertility rate, life expectancy, immunization, and access to sanitation, drinking water and electricity.

Odisha has among the best fiscal yardsticks due to its deft fiscal management.

The state has been running a revenue surplus, unlike the revenue deficit for an average state; holds very few contingent liabilities; and runs fiscal deficit within the limits mandated under its fiscal rule. The state’s capital expenditure has doubled to nearly 5 percent of its GDP during the last decade, and far exceeds that of an average state.

Further, under most conceivable scenarios, its already small public debt is projected to decline further.

Yet, Odisha still lags on a host of indicators, including urbanization (its urbanization rate of 18 percent is only half that of the national average); enrollment ratio in higher education (which is only 22 percent compared to national average of 28 percent and much below that of the leading states such as Tamil Nadu’s 47 percent); and bank credit to GDP ratio (which at 29 percent is nearly half that of the national average).

Examples such as these indicate that despite lifting itself from the rank of a low-income economy to that of a low middle-income one, the state has miles to cover for it to become an advanced economy or to contribute to nation’s goal of becoming an advanced economy during the coming years.

So what may Odisha do to take a leap into the club of richer states such as Gujarat, Tamil Nadu and Karnataka, leaving behind the company of poorer states such as Rajasthan and West Bengal.

First and foremost, the state needs to elevate its aspirations. It should aim to attain double-digit growth rate and prepare its policy framework accordingly.

Second, a high middle-income economy with a per capita income of $4500, or a high-income economy with a per capita income of $12500, looks very different from today’s Odisha with a per capita income of about $2000.  Higher income economies are less dependent on agriculture and more on manufacturing and modern services; less rural and more urban; more digitally connected; more innovative; and more capital and skill- intensive. For Odisha to aspire to be an upper middle-income or a high-income economy, it ought to steer its growth strategy keeping these end goals in sight.

Doing so would require allocating public expenditure suitably on urbanization, skill formation, and R&D; simultaneous development of institutions and state capacity; and far greater domestic and international integration to attract capital, technology, and access to markets.

Third, its development strategy may emulate success stories in specific sectors from various other states and countries. For example, it can take cue from Kerala and Goa in international tourism (Odisha gets only 0.7 percent of the domestic and 0.4 percent of international tourism); Karnataka and Telangana in offering an alternative IT hub; and Tamil Nadu and Gujarat in manufacturing.

Unless Odisha pursues a more ambitious pathway, it may soon find the existing drivers of growth running out of steam. Early evidence points to such a possibility. Its GDP growth has decelerated to 6.6 percent during the last decade from 8.1 percent in the preceding decade. Worryingly, deceleration has been equally noticeable in manufacturing, mining, and services.

Odisha now has all the conditions to be the next breakout state, for which it should be very proud. What it needs now is to shift gears.

Key Statistics for Odisha and the National Averages

The writer is director general of National Council of Applied Economic Research. Views are personal.

Why Is Europe Losing the Productivity Race?

HONG KONG – The gap between productivity growth in the United States and Europe paints a stark and, for Europeans, depressing picture. In the two decades since 2004, US productivity growth, as measured by the value of output per hour worked, has been more than double that of the eurozone. Whereas eurozone productivity has flat-lined and even fallen slightly since the outbreak of the COVID-19 pandemic, US non-farm output per hour has risen by more than 6% over the same period – more than adequate performance by America’s own historical standards.

Something seems to be going seriously right in the US and seriously wrong in Europe. Some accounts point to the strong fiscal stimulus applied in the US since the outbreak of the pandemic. For Europeans this explanation is reassuring, because it suggests that the differential is transitory. After all, the US can’t run massive budget deficits and live beyond its means indefinitely.

But while strong spending stimulus can trigger rapid output and employment growth, it is not clear why it should produce faster productivity growth. On the contrary, given strong employment growth and tight labor markets, one might expect US companies to be forced to take on less productive workers, with negative implications for output per hour. More likely, tight labor markets in the US may mean that firms, unable to find an adequate supply of workers at any price, are impelled to substitute capital for labor – to invest in labor-saving technology.

Americans visiting a bank branch will encounter plenty of ATMs but sometimes not a single human teller. They are compelled to order meals, even at white-tablecloth restaurants, using a QR code. Patrons of Parisian bistros horrified by this thought may argue that a Franco-American cultural difference is at work. But it is hard to deny that tight labor markets also play a role.

Recall, however, that US productivity growth had accelerated relative to Europe’s already in the decade leading up to the pandemic, when labor markets were not so tight. Both the US and Europe turned to fiscal consolidation following the 2008 global financial crisis. Europe might have been slightly more hell-bent on austerity, but there was not enough difference in demand conditions to explain their different productivity outcomes.

Moreover, while American firms have been quicker to capitalize on digital technologies, the timing is wrong here, too: US outperformance in computer producing and using sectors was most pronounced in the decade preceding the global financial crisis, not in the period since.

And it is not as if European managers are unaware of the labor-saving and productivity-enhancing potential of digital technologies. It could be that Europe’s strong trade unions, fearing job destruction, resist their adoption, although Germany, with a tradition of strong unions, has some of the most robot-intensive factories in the world.

Alternatively, restrictive European Union rules may be impeding adoption. The EU’s data-privacy regulations, and now its proposed AI rulebook, if adhered to strictly, may slow the development of AI applications.

Finally, it could simply be that Europe has had bad luck, specifically in the form of Russian President Vladimir Putin and his energy-price shock. The US, being self-sufficient in energy, has not been vulnerable to energy-supply disruptions to the same degree. European firms, in contrast, have been forced to suspend their most energy-intensive operations or else to engage in costly restructuring, which is not good for productivity.As for the latest round of new digital technologies, firms are only just now beginning to explore how large language models and generative artificial intelligence can be used to boost productivity. In other words, AI and related developments can’t explain America’s unusually strong productivity performance in the last four years. In fact, history suggests that capitalizing on radical new technologies requires firms to reorganize how they do business, a trial-and-error process that takes time. The inevitability of errors means that productivity is likely to fall before rising, a phenomenon economists call the “productivity J-curve.”

Mario Draghi, Europe’s senior economic statesman, will present the EU with a set of proposals later this year for boosting productivity. No doubt, he will recommend completing Europe’s capital-markets union so that firms can more easily finance investments in new technologies.

Draghi will recommend removing barriers to competition, which would intensify the pressure on firms to innovate in order to survive. He will advocate greater energy efficiency and self-sufficiency to free Europe from more Putin-like disruptions.

Observers like me can confidently predict what Draghi will recommend because such proposals have been around for years. Europe should move now to implement these old ideas. And it desperately needs to come up with new ones.

Barry Eichengreen, Professor of Economics and Political Science at the University of California, Berkeley, is a former senior policy adviser at the International Monetary Fund. He is the author of many books, including In Defense of Public Debt (Oxford University Press, 2021).

Will e-mobility go the biofuel way?

EVs’ growth may suffer due to problems of battery availability and disposal, just as biofuel has been hit by feedstock constraint.

E-mobility seems to be the buzzword in India now. Almost every other day, some news comes out on how much progress India has made in the use of electric vehicle in the transport sector and how it helps in reducing carbon emission. While the progress in the use of e-vehicle is a fact, the carbon saving due to use of the same is highly exaggerated for the simple fact that India is still heavily dependent on fossil-based electricity for recharging e-vehicles.

Thus, unless we can tilt the balance sharply in favour renewables-based electricity, there will be a net increase in carbon emissions, as per IEA analysis, when considering life-cycle emissions. Moreover, as e-vehicles weigh more than internal-combustion (IC) vehicles, it may lead to higher tyre-related particulate emissions, even though it removes tailpipe emission of IC-vehicles.

Range anxiety, in terms of availability of charging infrastructure for an e-vehicle is a concern in India, especially in rural/ remote areas and highways, and also the charging time is longer than refuelling an IC vehicle. Setting up a charging station is capital intensive, both in terms of land and technology. Widespread adoption of e-vehicle can affect electricity grids, especially at peak hour of demand. Battery swapping, where a depleted battery can be replaced with a pre-charged one, can save time for full charging, but the technology is yet at a nascent stage in India, and significant investment and co-ordination among the stakeholders are required to develop the infrastructure.

Additionally, it also requires standardisation of the battery design, efficient testing and compliance for compatibility adherence. With the growth of e-vehicles, there is a need to increasingly focus on supply-chain related issues, particularly batteries. The manufacture of batteries for e-vehicles is growing at a much slower pace than the adoption of vehicle use, and thus India is following an import dependent pathway. This is a very risky proposition.

As all countries move towards e-mobility and most of them bank on imports for sourcing of battery, the prices of batteries may skyrocket in the coming years, especially as some of the raw materials are sourced from limited geographic regions. Thus, near self- sufficiency in batteries is a must for faster adoption of e-vehicles. This would not only safeguard India from the vagaries of global battery price, just like crude oil prices, but will also pave the way for growth of jobs in the sector. Surely, the job prospects will be higher if the domestic supply chain of e-vehicles is developed as far as possible.

CBAM effect

With growth of e-vehicles, the disposal of batteries will be a matter of environmental concern. India is not paying enough attention to this. It appears India has yet to learn the lesson from the CBAM (Carbon Border Adjustment Mechanism) experience. Looking back, developing countries like India were quite happy when ‘dirty’ industries from the EU moved to their shores following the Kyoto Protocol. Three decades later, the EU comes up with CBAM, which is likely to affect some of our industries. The EU has already announced that the reach of CBAM will be expanded to other sectors. Most likely e-waste, particularly batteries, will be on top of their agenda. The EU’s policy is stringent on the same and to create a level-playing field, it will expect partner countries to be on the same page in this respect.

A decade back, the kind of hype currently being witnessed in the case of e-mobility was observed in the case of biofuel. Down the line, however, we are yet to achieve 20 per cent blending target, even though at one point the government gave tax incentives for flexi-IC vehicles so that it is technically possible to run a vehicle on 100 per cent biofuel, just like in Brazil.

However, biofuel growth did not take off like in Brazil. The weakness in feedstock for biofuel was the real bottleneck, even though India is self- sufficient in other parts of the supply chain for biofuel.

On the jobs front, e-mobility is no match to the biofuel sector. However, not much attention has been paid to increase the feedstock supply of biofuel by way of scientific research to increase the oil-bearing capacity of biofuel feedstock. While India has achieved success in food crops through the Green Revolution, this sector has not receive similar attention. Productivity, and not land, probably is the principal constraint for its growth.

Unless sufficient attention is paid to supply bottlenecks and the battery disposal issue, e-mobility may go the biofuel route. A collective and co-ordinated effort is required from the government, industry and other stakeholders to develop infrastructure, facilitate a supply-chain that includes domestic manufacturing, increase awareness about battery disposal, and incentivise adoption to cater to the increasing demand for fuels triggered by a large and growing population and expansion of urbanisation in the country.

Sanjib Pohit is Professor at NCAER and Chetana Chaudhuri is Fellow at NCAER. Views are personal.

    Get updates from NCAER