Innovation as national strategy: Can India invest its way to Viksit Bharat?

While global innovation leaders invest 2-4.5% of their GDP in R&D, the figure stands at 0.64% for India. In this post, Mondal and Pohit contend that the country ought to recognise R&D as an economic engine, raising public investment and the contribution of the private sector. Further, instead of only playing catch-up, there is a need to proactively develop a technology forecasting strategy.

What drives true innovation – talent, ambition, or opportunity? In reality, innovation is driven by investment: consistent, strategic, and future-oriented spending on research and development (R&D). Nations that dominate the global technology landscape today – whether the United States, Japan, South Korea, or China – did not get there by chance. They got there by investing where the future is. India now stands at a similar crossroads. If we aspire to a Viksit Bharat1 by 2047, India’s sluggish response to R&D cannot be a supporting activity; it must be treated as the economic engine.

For over a decade, India has urged its industries to innovate and manufacture domestically. Yet, the country’s R&D spending tells a different story. According to the latest national R&D statistics, India’s Gross Expenditure on Research and Development (GERD) stood at 0.66% of GDP (gross domestic product) in 2018-19 and 2019-20, and then dropped marginally to 0.64% in 2020-21. In contrast, the global average is 1.8%, and innovation leaders routinely invest 2-4.5% of GDP. Even smaller East Asian economies – South Korea and Taiwan – invest between 3% and 5% of GDP annually. India’s private sector contributes only 36% to total R&D expenditure, compared to 50-70% in advanced economies.

Figure 1. GERD and GERD-to-GDP ratio, by selected region or country, 2022 or most recent year

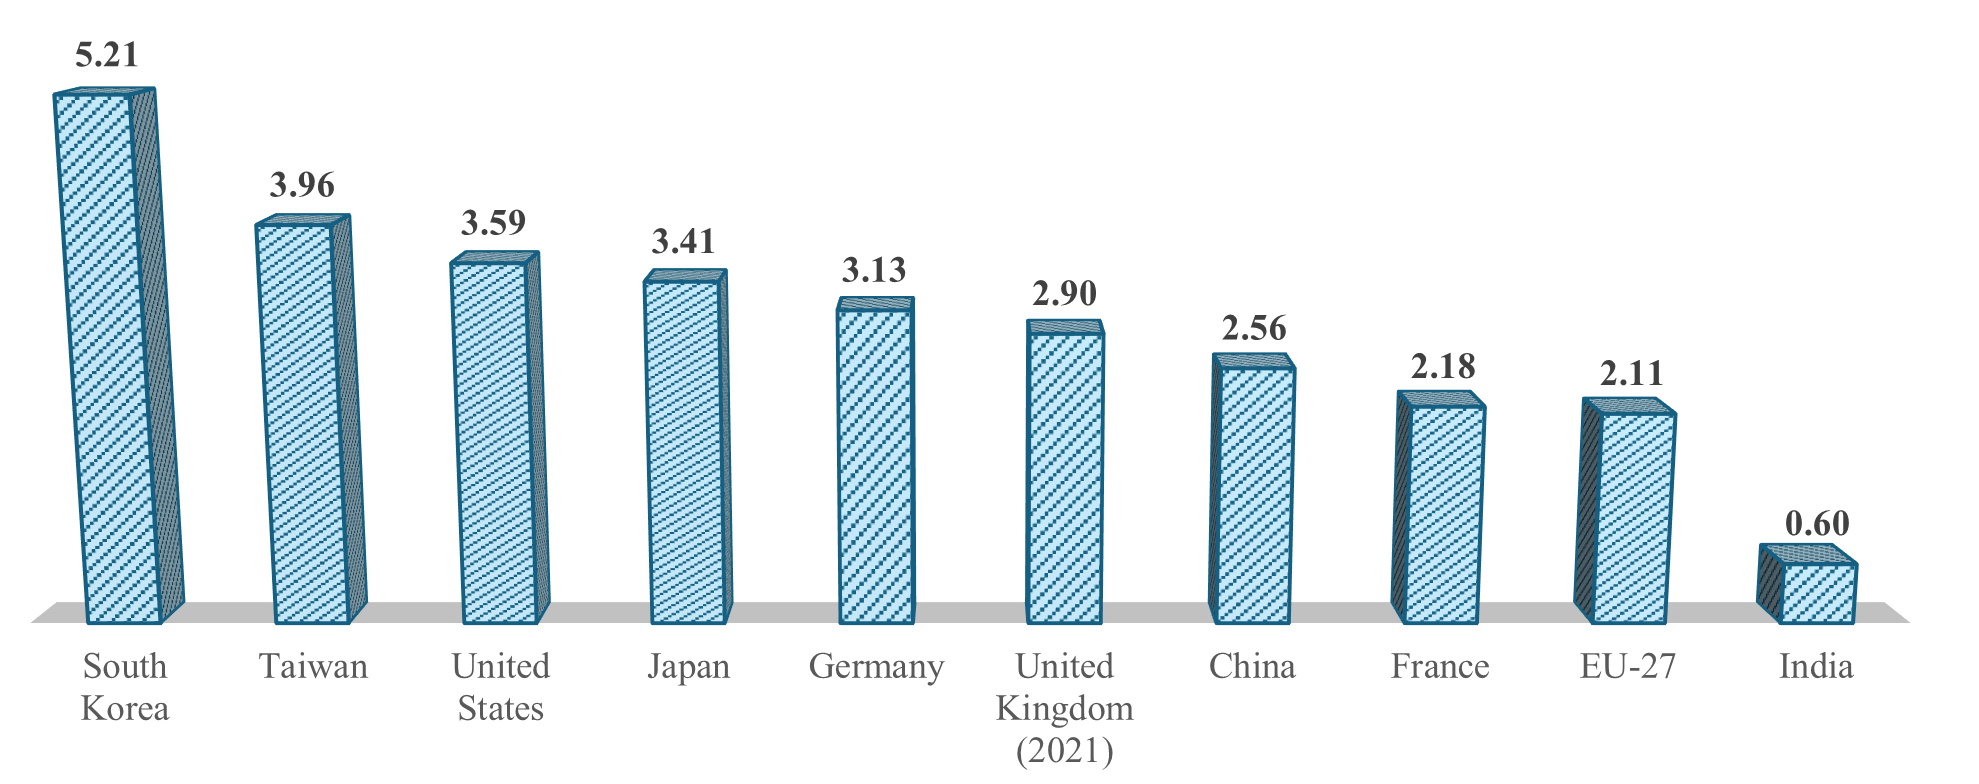
Source: National Center for Science and Engineering Statistics, National Patterns of R&D Resources (2021-22 edition); Organisation for Economic Co-operation and Development, State of Industry R&D in India (IIFL Securities, 2024).

The result is predictable. India enters late into emerging technology arenas. By the time we master an existing technology, the market has already moved ahead – either up the value chain or into new scientific frontiers. This delays value capture, reduces competitiveness, and limits the gains Indian firms can enjoy from innovation-led growth.

What leading nations do differently

The difference between leading and lagging nations lies in one critical capability: technology foresight. While India has often reacted to global developments, others have anticipated them.

In Japan, technology forecasting exercises involve more than 2,000 top scientists and technologists, mapping out possible technology trajectories over a 25-year horizon. The outputs directly shape budget priorities, industrial strategy, and R&D funding. Japan’s early foresight in robotics and materials science ultimately enabled it to become a global leader in advanced manufacturing.

China’s transformation is even more striking. Its first major foresight initiative dates back to 1956, involving over 1,000 senior scientists who identified long-term science and technology priorities. In 2003, China conducted a major foresight exercise – “Technology Foresight toward 2020” – involving 60 leading scientists and over 320 experts across 32 subfields. Technologies were evaluated not just on scientific potential but on three economic indicators: contribution to economic growth, improvement in quality of life, and national security. Among the top priorities identified were high-efficiency solar cells, advanced biofuels, gene editing, large-scale integrated circuits, antiviral therapeutics, and advanced alloys. Today, China leads in several of those same fields.

Figure 2. Strategic chain followed by global innovation leaders

India never institutionalised this rigor. Except for a limited exercise by Technology Information, Forecasting and Assessment Council (TIFAC) in the 1990s, technology foresight never became an annual or systematic function linked to budget allocation. The result: fragmented R&D investment without a sharp national focus.

India’s turning point

India is finally recognising that innovation cannot be left to chance; it must be designed. Over the last few years, major flagship missions have been launched, demonstrating a strategic shift in the government’s approach – linking innovation, investment, and industrial capability. 

The most significant push came in November 2025, when the Government of India launched the Research Development and Innovation (RDI) Scheme Fund, a landmark Rs. 1 lakh crore fund dedicated to catalysing industry-led R&D. For the first time, India’s innovation financing architecture places the private sector – not just government labs – at the centre of R&D expansion. This directly addresses India’s structural bottleneck: the low share of industry-funded research. If India wants products and technologies to reach the market, industry must lead, academia must partner, and government must enable.

Complementing this shift is the India Semiconductor Mission (ISM), launched in 2021. Backed by a Rs. 76,000 crore Production Linked Incentive (PLI) scheme – Rs. 65,000 crore of which is already committed – the mission is creating India’s semiconductor ecosystem. India has approved 10 semiconductor projects across six states, with total investments reaching Rs. 1.60 lakh crore. These include the country’s first commercial Silicon Carbide fabrication plant in Odisha. Semiconductors are the backbone of every modern technology – from smartphones to electric vehicles to national security assets. For the first time, India is not attempting to catch up; it is laying the groundwork to compete.

Similarly, the Deep Ocean Mission (DOM), launched in September 2021 with Rs. 4,077 crore, places India firmly in the global race for deep-sea resources and marine biotechnology. With 7,517 km of coastline and strategic access to deep-sea mineral reserves, India recognises that future resource security will not depend solely on land-based extraction.

Meanwhile, the IndiaAI Mission, approved in 2024 with Rs. 10,371.92 crore, aims to “Make AI in India and Make AI Work for India”. The mission has already expanded computing infrastructure from an initial target of 10,000 Graphics Processing Units (GPUs) to 38,000 GPUs, dramatically improving access for startups, researchers, and enterprises. At a time when global AI compute costs are skyrocketing, enabling public access to AI infrastructure is a competitive advantage.

Beyond missions and budgets, India’s biggest strategic edge is something intangible yet transformative: Digital Public Infrastructure (DPI). Unlike Western economies where digital rails are owned by private corporations, India has built open, interoperable platforms that democratise access to technology.

A notable example is the Unified Payments Interface (UPI). In August 2025 alone, UPI processed over 20 billion transactions worth Rs. 24.85 lakh crore, representing 85% of India’s digital payments. UPI now operates in seven countries—including France, Singapore, UAE, and Mauritius – showcasing that Indian technology can scale beyond borders. UPI proves something fundamental: innovation does not only emerge from high R&D spending; it emerges from public digital infrastructure that fuels experimentation.

DPI is enabling a unique innovation model – frugal, scalable, inclusive, and exportable. But DPI cannot compensate for underinvestment in frontier technologies like deep tech manufacturing, biotechnology, advanced materials, and semiconductors. For that, India must invest significantly more.

However, many of these sectors have been selected based on the experiences of other countries. From the Indian perspective, we need to undertake a deep-down technology forecasting exercise to narrow down the sectors where investment in R&D may give fruits in the next 20 years.

Innovation cannot be purely aspirational – it must be funded

India has the talent, the demographic dividend, and the ecosystem. What we need now is aggressive investment and prioritisation.

If India is serious about becoming a developed nation by 2047, R&D expenditure must rise to at least 2% of GDP over the next decade, with the private sector contributing 60% or more. This is not a cost – it is an investment in economic competitiveness, technological sovereignty, and national power.

Another problem with India’s innovation system is that we are largely engaged in incremental innovation and not breakthrough innovation. Nine out of 10 breakthrough innovations end up failing. In the Indian R&D system, no one wants to be associated with failure, as the committee members of the research grantee or the researchers may come under the CAG (Comptroller and Auditor General) lens for wasteful expenditure.

India’s rise will not be defined by how fast it adopts existing technologies, but by how boldly it invests in creating the next ones – the path to Viksit Bharat begins when India stops catching up and starts setting the pace with other nations in the race.

The views expressed in this post are solely those of the authors, and do not necessarily reflect those of the I4I Editorial Board.

Note:

  1. Viksit Bharat, meaning “Developed India”, Viksit Bharat 2047 is the government’s vision to transform the country into a self-reliant and prosperous economy by 2047. Economic growth, technological upgradation, infrastructure development, social empowerment, and sustainability are the criteria of this programme.

Balancing Affordability and Financial Sustainability in Urban Metro Systems: Evidence from Hyderabad Metro

In May 2025, Hyderabad Metro Rail implemented its first major fare revision in over seven years. While the initial increase—based on recommendations of the Fare Fixation Committee—was announced mid-month, public concerns led to a subsequent 10 per cent discount being applied within days. The episode highlights a recurring challenge in India’s urban transport systems: how to adjust fares in a politically and socially acceptable manner while ensuring the financial sustainability of capital-intensive metro projects.

The fare revision is particularly significant because it follows years of fare rigidity, despite rising operating costs and repeated institutional reviews. Hyderabad Metro had not revised fares since operations began in 2017. During this period, energy prices, staffing expenses, and maintenance costs increased steadily, while fare revenues remained constrained by an unchanged fare structure. The eventual correction—followed by a partial rollback—illustrates the difficulty of implementing large, delayed adjustments after prolonged inaction.

This challenge is examined in detail in a study by the National Council of Applied Economic Research (NCAER), submitted in early 2023 as part of an assessment supporting the Fare Fixation Committee’s recommendations. Based on primary surveys of metro users and non-metro commuters, the study analysed commuter willingness to pay, fare acceptance thresholds, and the widening gap between operating costs and revenues when fare revisions are deferred. The Hyderabad case thus offers timely empirical insight into the consequences of postponing fare rationalisation.

Despite a strong post-pandemic recovery in ridership, Hyderabad Metro continued to report persistent operating losses prior to the fare revision. The reason lay not in insufficient demand, but in a structural mismatch between fares and costs. While fare revenues fluctuated with ridership cycles, operating costs followed a more rigid upward path, eroding financial resilience over time. The eventual fare hike—and the public response it triggered—underscores the risks of allowing this gap to widen unchecked.

The key policy question, therefore, is not whether fare revisions are necessary, but how they can be designed and timed to balance commuter affordability with long-term system viability.

The Cost–Fare Mismatch

Metro systems are characterised by high fixed costs. Energy expenses, staffing, routine maintenance, and safety obligations do not decline proportionately when ridership falls. In Hyderabad, operating costs have followed a steady upward trajectory over time, driven by rising electricity tariffs, wage bills, and maintenance requirements. Fare revenues, on the other hand, have been far more volatile—closely tracking ridership fluctuations rather than reflecting any change in fare policy.

An indexed comparison of operating costs and revenues (with FY2018 as the base year) reveals a crucial insight. While fare revenues occasionally outpace operating costs in indexed terms during high-ridership years, this does not indicate fare adequacy. Revenues rise primarily because more passengers are travelling, not because fares are aligned with the underlying cost structure. This distinction becomes clear when operating profitability is examined. The Hyderabad Metro has reported persistent operating losses and negative post-tax profitability, even during periods of ridership recovery.

Deferred fare revisions thus create a structural problem: costs continue to accumulate, while fares remain anchored to an earlier cost environment. Over time, this erodes the financial resilience of metro systems and increases dependence on debt restructuring, cross-subsidisation, or public support.

Are Commuters Willing to Pay More?

A common concern in fare revision debates is affordability. Higher fares are often assumed to deter ridership and push commuters back to private or informal modes of transport. Survey evidence from Hyderabad, however, paints a more nuanced picture.

Among existing metro users, a substantial majority indicate willingness to accept moderate fare increases. Acceptance rates remain high for fare hikes up to 30–40 per cent, suggesting that commuters value the metro’s time savings, comfort, and reliability. Importantly, this willingness is observed across income groups. Even among households earning below Rs. 50,000 per month, acceptance rates for higher fares exceed 75 per cent. This challenges the notion that fare revisions are inherently regressive, especially when metro travel substitutes for costlier or less reliable alternatives.

The income distribution of metro users also matters. Survey data show that over half of metro commuters belong to middle-income households, with monthly incomes between Rs. 30,000 and Rs. 70,000. For these users, the metro competes not just with buses, but with two-wheelers, autos, and app-based cab services. In this context, modest fare increases may still leave metro travel competitive on a generalized cost basis, once time savings and reliability are accounted for. The eventual fare revision in May 2025 broadly aligns with acceptance thresholds identified in the NCAER survey, though the initial magnitude may have exceeded what many commuters perceived as gradual or predictable.

Scope for Mode Shift

Fare policy also influences mode choice beyond existing metro users. Among non-metro commuters surveyed in Hyderabad, more than half reported that they would consider shifting to the metro at existing fares. Even when higher fares are assumed, a significant share—around 45 per cent—remain willing to shift.

Auto users and four-wheeler commuters show particularly high willingness to transition, reflecting the metro’s advantage in terms of travel time and predictability for medium-distance trips of 10–12 km. This suggests that fare rationalisation, if calibrated carefully, need not lead to a loss of ridership. Instead, it may still support modal substitution away from private and para-transit modes, reinforcing congestion and environmental benefits.

Rethinking Fare Policy

The Hyderabad experience underscores a broader policy lesson: fare freezes are not a sustainable affordability strategy. By postponing fare revisions, operators accumulate financial stress that eventually necessitates sharper adjustments or greater fiscal support. Gradual, predictable fare indexing—linked to input costs or inflation—can reduce this risk while providing transparency to users.

At the same time, fare policy should not operate in isolation. Targeted concessions for vulnerable groups, integration with feeder services, and improvements in first- and last-mile connectivity can preserve inclusivity even as average fares rise. Importantly, public communication matters. When commuters understand that fare revisions are tied to service continuity and quality, resistance tends to be lower. The Hyderabad experience shows that even when fare revisions are institutionally approved, political transitions can delay implementation, turning a technical pricing issue into a recurring fiscal risk. The partial rollback following public feedback reinforces the case for phased, predictable fare revisions rather than infrequent, sharp corrections.

The Way Forward

India is investing heavily in urban metro systems, with projects underway or planned across multiple cities. As networks expand, the question of financial sustainability will become even more pressing. The Hyderabad Metro’s experience shows that affordability and sustainability need not be opposing goals—but balancing them requires timely fare rationalisation, evidence-based policy, and transparent engagement with users.

Ignoring cost realities does not protect commuters in the long run; it merely postpones the adjustment. A financially sustainable metro system, priced rationally and supported by complementary policies, is ultimately the most affordable option for cities seeking efficient, inclusive, and resilient urban mobility. Hyderabad’s experience shows that delaying fare revisions does not eliminate political resistance—it merely concentrates it when adjustments finally become unavoidable.

Saurabh Bandyopadhyay is Senior Fellow and Isha Dayal is Fellow at NCAER. Views are personal.

Reforming India’s Vocational Skilling Ecosystem

India needs to sharply increase the productivity of its labour force and invest in enhancing the skill levels of its working age population to achieve the goal of “Viksit Bharat” by 2047. The insufficient and poor engagement of the working-age population, combined with increasing capital deepening across sectors, highlights pressing challenges on both the supply and demand sides of the labour market (Afridi et al., 2025). These dual constraints, including the limited supply of skilled labour and the economy’s insufficient capacity to productively absorb the workforce, need to be addressed urgently.

Outlook 2026: Emerging markets will need a new playbook

Institutional autonomy, not the cycle, will shape outcomes.

Global financial institutions continue to frame the 2026 outlook for emerging markets through a familiar cyclical lens. The consensus assumes US monetary easing, a softer dollar and a modest global slowdown will favour local-currency assets, credible disinflation paths and balance-sheet repair. This narrative is historically grounded and internally coherent. It is also increasingly insufficient.

The central risk in 2026 is not misjudging the cycle but misidentifying the constraint. Treating emerging markets as a homogeneous asset class that responds to price signals within a stable global financial regime simply no longer reflects the current operating environment.

The global financial system now operates within a fragmented institutional architecture, characterised by overlapping legal jurisdictions, competing settlement systems, closer alignment between finance and industrial policy, and the growing use of sanctions.

In this environment, the binding constraint for emerging and developing economies isn’t the marginal cost of capital, it is institutional autonomy: the capacity to run across multiple financial and regulatory systems without surrendering long-term policy space or control over strategic assets.

This constraint is not evenly distributed. Large economies with deep institutions – such as India, Brazil, Mexico and Vietnam – face a different problem from smaller, single-channel borrowers. Size and institutional capacity are not independent variables. Together, they determine whether fragmentation expands or narrows the room for manoeuvre.

The phase now underway is therefore one of differentiated institutional positioning, in which outcomes will diverge by capacity and scale rather than converge through growth cycles. That divergence is most visible in how capital is raised and governed.

Control, not funding

Fragmentation first appears in infrastructure finance. Development finance has moved away from standard sovereign borrowing towards layered capital structures that combine policy guarantees, concessional tranches, state-linked lenders and embedded project-level control rights.

This shift coincides with a structural contraction in traditional external financing. Foreign direct investment into EMDEs has fallen from around 5% of gross domestic product before the global financial crisis to just over 2% today. This decline reflects more than cyclical risk aversion. It points to a deeper transition in which control over capital, rather than its price alone, has become central to economic sovereignty.

As the capital stack becomes the locus of decision-making, macroeconomic stabilisation is no longer sufficient. The core policy problem shifts from managing rollover risk to preserving infrastructure optionality. Decisions embedded in ports, power grids, transport corridors and digital networks generate long-lived path dependencies that shape trade patterns, technology choices and geopolitical exposure.

For large economies with diversified financing options and institutional capacity, such commitments can be absorbed and, if necessary, renegotiated. For others, they hard-wire dependence. By 2026, control over the capital stack will be a central determinant of resilience, but only where scale and institutional depth make that control meaningful. The same asymmetry is now emerging in the payments system.

Settlement efficiency and the diagnostic challenge

Much public debate continues to focus on de-dollarisation. The more consequential development lies elsewhere: rapid improvements in cross-border settlement infrastructure. Platforms such as Project mBridge and related wholesale digital-currency arrangements have reduced settlement times and lowered transaction costs.

Settlement efficiency, however, is not external balance. Faster payments reduce friction without altering underlying trade structures. Capital goods and high-value intermediates can be imported with increasing ease, while exports in many emerging economies remain concentrated in volatile or lower value-added segments. In several non-commodity EMDEs, non-oil trade deficits have widened even as exchange-rate volatility has declined.

This creates a diagnostic challenge. For large, institutionally capable economies with access to multiple financing channels, wider trade deficits may be manageable. Settlement efficiency reduces financing friction and expands options. For economies without such access, the same dynamics increase vulnerability. Smooth settlement, stable reserves and calm currencies can obscure deteriorating external positions until adjustment becomes unavoidable.

The frictionless deficit is most dangerous where institutional capacity to manage it is weakest. Settlement efficiency can delay adjustment, but it cannot resolve structural trade imbalances. When global liquidity tightens or commodity prices shift, that delay translates into a sharper correction and higher tail risk.

Institutional positioning and differentiated outcomes

In a fragmented global economy, institutional autonomy matters most for large EMDEs with diverse financing options. Its effectiveness depends on three conditions: size, institutional capacity and geopolitical room for manoeuvre.

Some economies meet these conditions. India’s current positioning combines participation in western semiconductor supply chains with continued engagement with China across trade, energy and defence. Vietnam similarly integrates into US- and Japan-centred manufacturing while maintaining diversified infrastructure relationships. In both cases, optionality is preserved through scale, institutional credibility and diversified linkages.

Other economies possess institutional depth but lack optionality. Mexico both benefits materially from nearshoring under the US-Mexico-Canada Agreement and has deep capital markets. Yet its structural dependence on North American supply chains limits its ability to pivot if political or trade conditions deteriorate. Institutional strength mitigates risk, but it does not eliminate exposure.

This differentiation matters because public debt ratios across emerging markets are materially higher than in the early 2010s, compressing fiscal space and increasing the cost of policy error. For economies with diversified access, this constraint is manageable. For others, it is binding.

What 2026 will test

If this framework is correct, outcomes in 2026 should diverge by institutional positioning rather than by macro fundamentals alone.

India is the clearest test case. Its current strategy preserves optionality across systems. If intensifying US-China competition forces a binary choice – through trade escalation, technology restrictions or geopolitical shocks – then geopolitical pressure, not institutional capacity, will determine outcomes. If optionality is preserved, the institutional-autonomy thesis holds.

Rigid anchors should exhibit higher foreign exchange volatility if their dominant trading bloc weakens. Economies without diversified access to financing should face earlier stress if external liquidity tightens. By late 2026, positioning-based segmentation should explain a meaningful share of variation in spreads and capital flows. These are testable claims.

Why portfolio frameworks will struggle

A common objection is that markets price cycles, not structure, and that Federal Reserve policy will dominate emerging market outcomes. This view underestimates how institutional architecture now conditions returns.

Now, capital is increasingly non-fungible. Project-linked finance with embedded control rights does not reprice or exit like portfolio flows. It reshapes the opportunity set itself. Improved settlement infrastructure delays adjustment rather than eliminating it, increasing tail risk. Portfolio flows still matter, but they increasingly follow rather than drive institutional decisions.

The geopolitical constraint

Multi-system positioning remains viable only within the bounds of geopolitical tolerance. If US-China competition forces binary alignment, optionality collapses. Russia and Iran mark the extreme, but the more immediate risk is choice-forcing for middle powers such as India, Vietnam and Mexico.

The standard emerging markets playbook – built around cycles, spreads and carry – has reached its analytical limits. By late 2026, geopolitical pressure may supersede institutional capacity as the binding constraint.

For policy-makers, the challenge is preserving policy space. For investors, it distinguishes genuine flexibility from apparent resilience built on fragile foundations. Returns will accrue to structure, not speed, only where structure is real and sustainable under stress.

Udaibir Das is a Member of the OMFIF Advisory Council, Visiting Professor at the National Council of Applied Economic Research, Senior Non-Resident Adviser at the Bank of England, Senior Adviser of the International Forum for Sovereign Wealth Funds, and Distinguished Fellow at the Observer Research Foundation-America

To make VB-G Ram G work, evaluate MGNREGA honestly

The impulse that led to the passing of MGNREGA celebrated the spirit of inclusive development. However, the engineering that rendered the spirit behind MGNREGA into functioning machinery requires repairs and unclogging. Unless we recognise both achievements and challenges facing MGNREGA, it will be difficult to repair it, and this omission will continue to haunt both.

The impulse that led to the passing of MGNREGA celebrated the spirit of inclusive development. However, the engineering that rendered the spirit behind MGNREGA into functioning machinery requires repairs and unclogging. Unless we recognise both achievements and challenges facing MGNREGA, it will be difficult to repair it, and this omission will continue to haunt both the present programme as well as its replacement, VB-G RAM G. How and where has MGNREGA succeeded? Its primary success lies in universal access that relies on self-targeting, reducing local bottlenecks. Making manual work available regardless of household economic status removes gatekeeping by local elites. Over the years, it has provided a safety net to households and employment to women and older Indians who would not easily find other jobs. Studies also suggest that it has been instrumental in increasing rural wages.

Nonetheless, cracks developed in this edifice over the years, reflected in growing inequality between states. In 2011-12, Kerala provided about 3.6 days of work per rural resident, but by 2023-24, the number of days had grown to 11.3. In contrast, UP stagnated with 1.7 days of work in 2011-12 and 1.9 in 2023-24. However, UP’s rural population is considerably poorer, with a monthly per capita expenditure of Rs 3,481 in 2023-24 compared to Rs 6,611 for Kerala. Universal schemes are supposed to be more inclusive of the poor, not less. What happened?

Part of the problem is that, since its inception, neither the UPA nor the NDA allocated sufficient funds for the scheme. Assuming only 50 days of work per rural household at the lowest prevailing wage of Rs 234, to fully fund the scheme would require more than Rs 2,10,000 crore in wages alone. Except for the pandemic years, the Centre’s allocation did not exceed Rs 86,000 crore. Due to a significant shortfall in funds, particularly in the second half of the fiscal year, payments for materials from the Centre were frequently delayed, forcing states to advance their own resources for infrastructure work. This usually benefited richer states. State governance efficiency in navigating the system also played a role. Kerala, for example, was able to spread work evenly throughout the year, whereas nearly 40 per cent of the MGNREGA days in UP were exhausted in the first quarter.

Many states combined other infrastructure activities with MGNREGA. Infrastructure schemes paid for construction materials, and MGNREGA paid for labour. This was a mixed blessing, since district magistrates were under pressure to use MGNREGA to supplement infrastructure activities, even in prosperous districts where local wages were higher than MGNREGA wages and demand for it was low, sometimes resulting in an unholy alliance with contractors. This suggests that if the MGNREGA is to function as a safety net for the poorest, many of whom live in poorer states that face significant administrative challenges, some restructuring is essential.

VB-G RAM G quietly moves away from universal entitlement to targeted benefits. However, would the proposed alternative redress inter-state inequality? Possibly not.

Moving from universal to normative allocation that favours poorer states and poorer districts within a state will create a mechanism that directs funds to those who need them most. However, the changed Centre-state allocation ratio will exacerbate challenges for states unable to meet their share. VB-G RAM G shifts the Centre-state contribution ratio from 90-10 to 60-40 for most states. Poorer states may not be able to meet this commitment. This could be particularly challenging as fiscal space available to states shrinks.

The challenge is to honestly evaluate which features of MGNREGA have stood the test of time and which require recalibration. While the right to employment is a heartwarming concept, it needs a wholehearted commitment of resources. An unfunded mandate leads to perversion of the original intent, making it only a “right” in name that often excludes the poor.

The writer is professor, NCAER and University of Maryland. Views are personal

    Get updates from NCAER